Monitoring
The operator exports Prometheus metrics. The chart can add a ServiceMonitor, alerts and a Grafana dashboard.
Turning it on
With the Prometheus Operator, or anything that understands its CRDs, such as kube-prometheus-stack or VictoriaMetrics:
helm upgrade kubepkg oci://ghcr.io/kuberoot-dev/charts/kubepkg -n kubepkg-system --reuse-values \
  --set metrics.serviceMonitor.enabled=true \
  --set metrics.prometheusRule.enabled=true \
  --set metrics.dashboard.enabled=true
metrics.serviceMonitorscrapes the operator every 30 seconds. Addlabelsif your Prometheus selects ServiceMonitors by label, for examplerelease: kube-prometheus-stack.metrics.prometheusRuleinstalls the alerts below.metrics.dashboardputs the dashboard in a ConfigMap labelledgrafana_dashboard: "1", which Grafana's dashboard sidecar picks up.
Without the Prometheus Operator, scrape the Service kubepkg-metrics on port 8080, path /metrics.
Metrics
| Metric | Type | Meaning |
|---|---|---|
kubepkg_package_ready{package} |
gauge | 1 when the package is ready, 0 otherwise |
kubepkg_package_info{package,version,revision} |
gauge | always 1; the labels carry the version and revision a package runs |
kubepkg_revisions_total{package,outcome} |
counter | revisions by outcome: applied, failed, rolled_back |
kubepkg_repository_ready{repository} |
gauge | 1 when the repository's index is loaded and accepted |
kubepkg_repository_index_generated_timestamp_seconds{repository} |
gauge | when the accepted index was built |
controller-runtime's own metrics come from the same endpoint. The kubepkg controllers are named kubepkg-package, kubepkg-repository, kubepkg-cluster and kubepkg-package-set.
Useful queries:
# packages that are not ready
kubepkg_package_ready == 0

# which version of cert-manager each cluster runs (with a cluster label from your Prometheus setup)
kubepkg_package_info{package="cert-manager"}

# failed and rolled back upgrades over the last day
increase(kubepkg_revisions_total{outcome=~"failed|rolled_back"}[1d]) > 0
Alerts
| Alert | Fires when | Severity |
|---|---|---|
KubepkgPackageNotReady |
a package has not been ready for 15 minutes | warning |
KubepkgUpgradeFailed |
a revision failed or was rolled back in the last 30 minutes | warning |
KubepkgRepositoryNotLoaded |
a repository's index has not been accepted for 30 minutes | warning |
KubepkgRepositoryStale |
a repository's accepted index is older than metrics.prometheusRule.indexMaxAge (default one week) |
info |
KubepkgReconcileErrors |
a kubepkg controller has been failing to reconcile for 15 minutes | warning |
KubepkgRepositoryStale matters most for repositories whose indexes expire. Set indexMaxAge below the expiry the repository signs with, so a stuck publishing pipeline is noticed before clusters refuse its index.
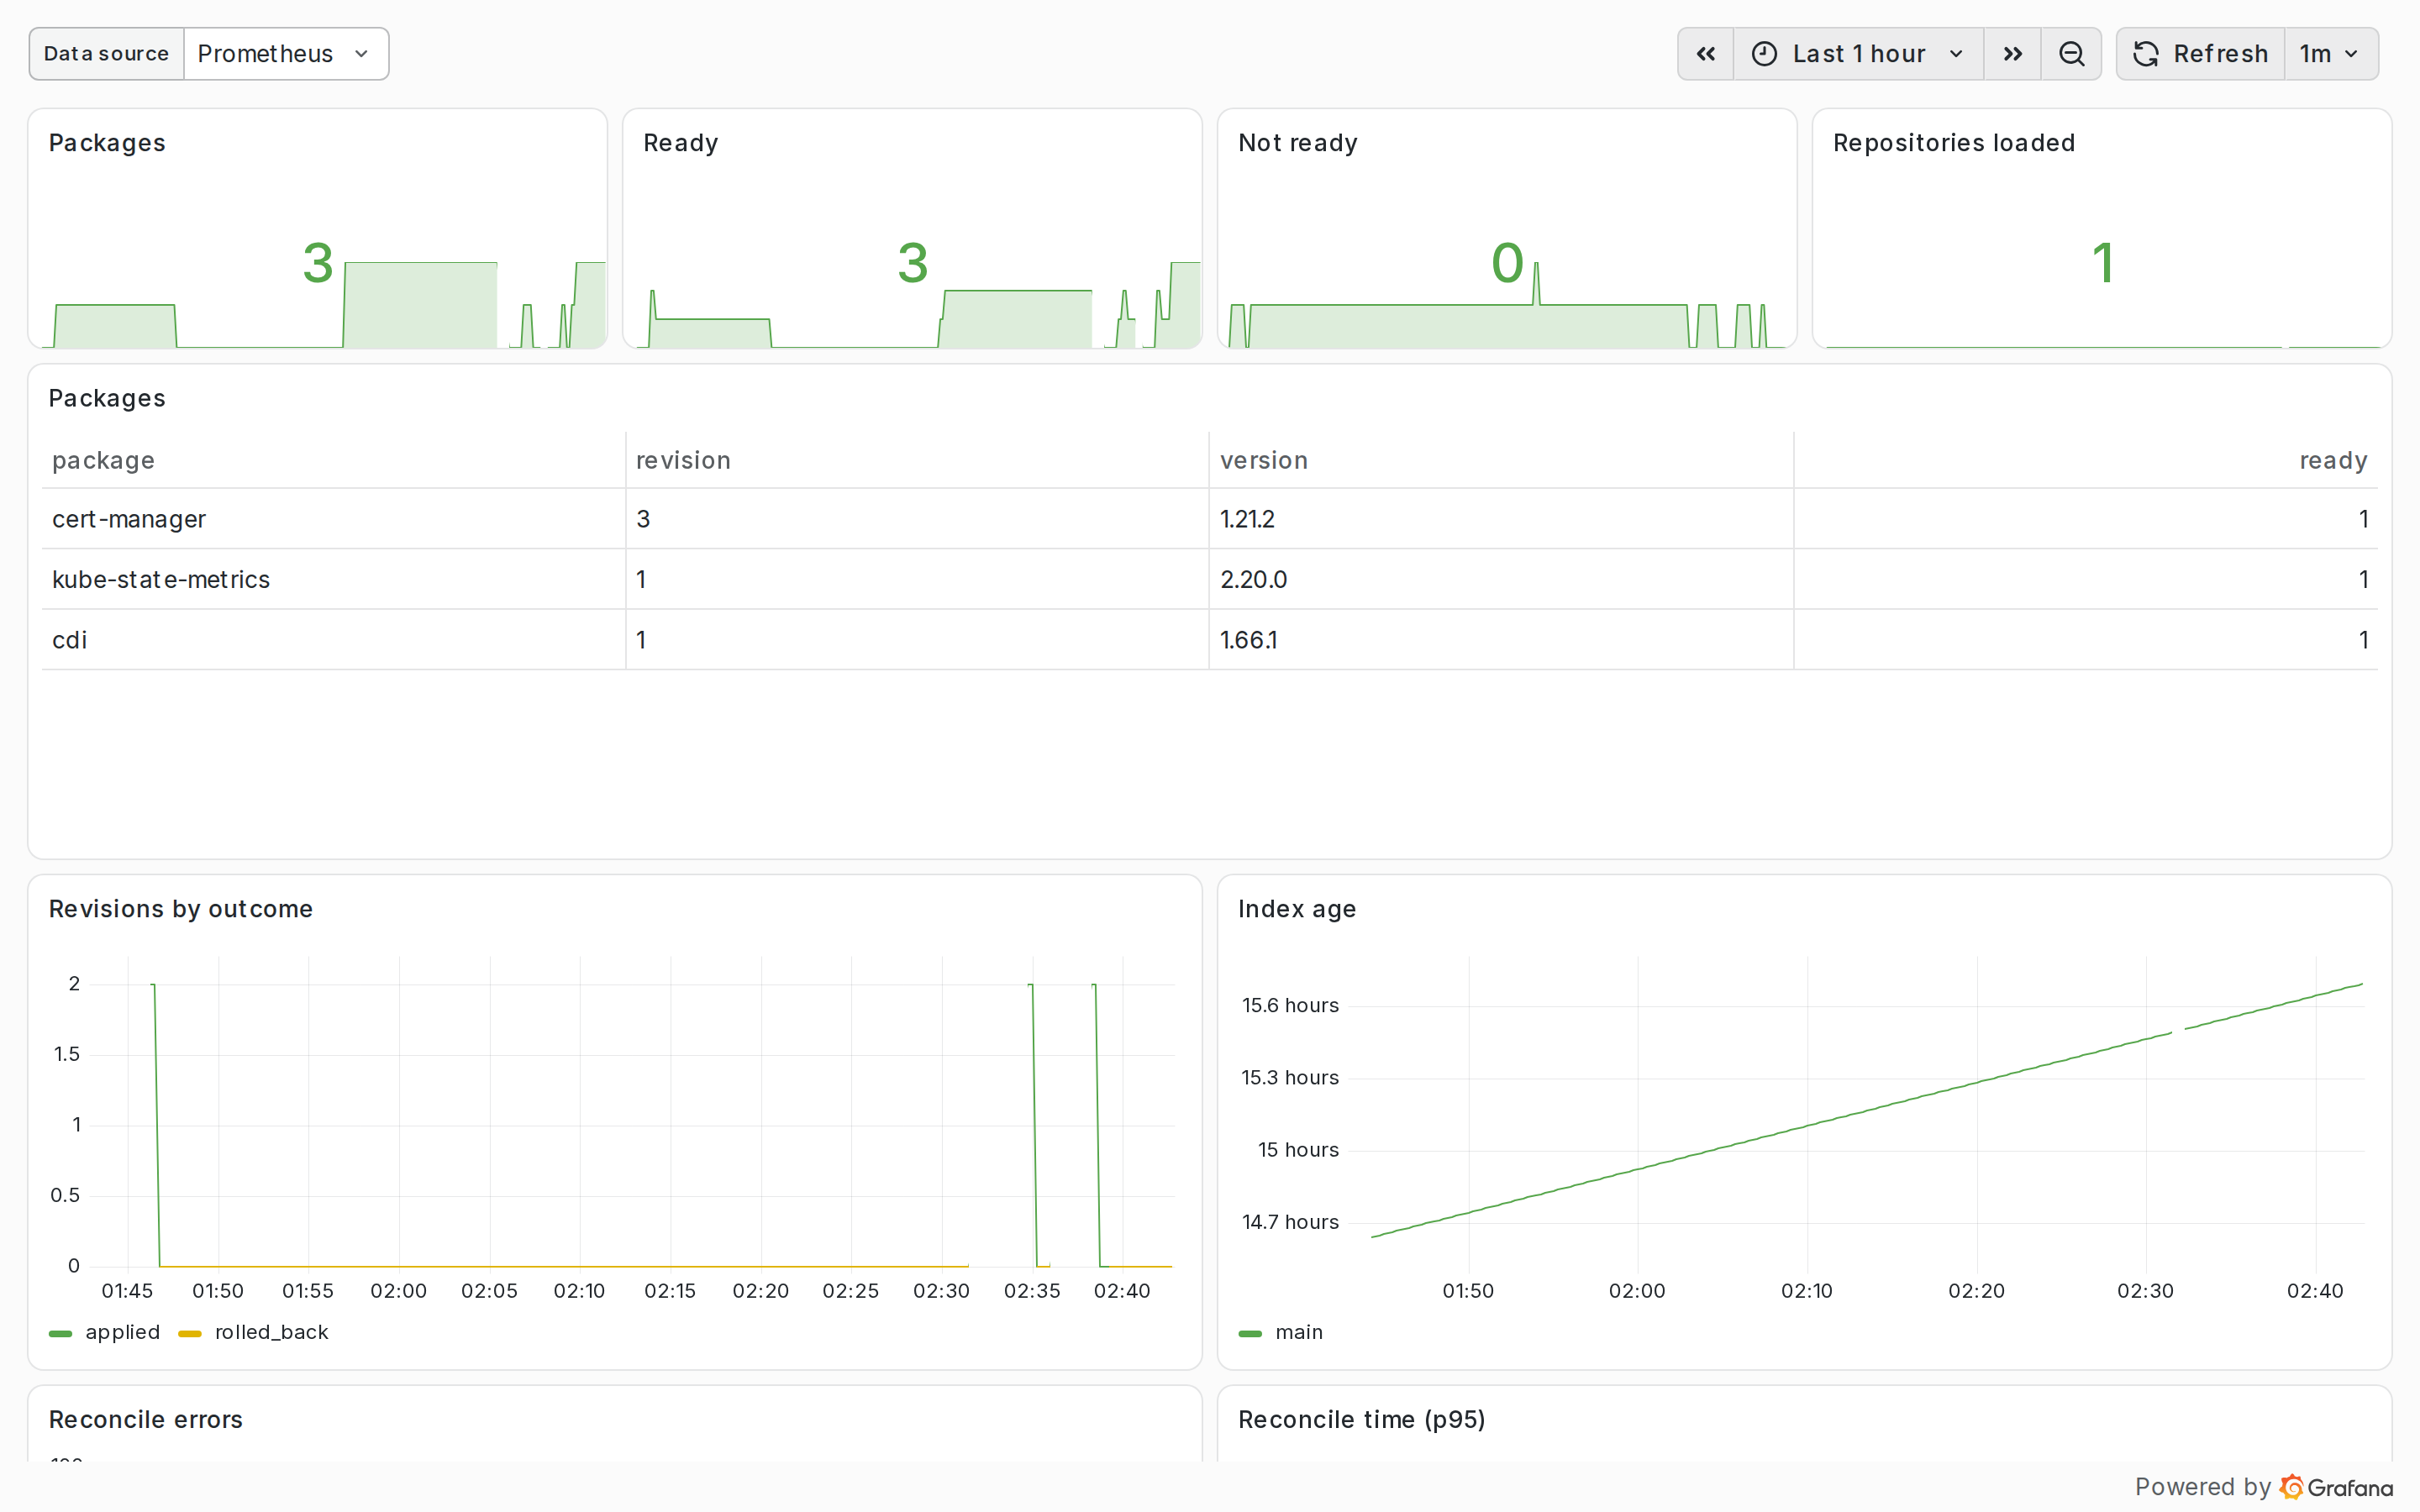
The dashboard
The dashboard shows:
- the number of packages, and how many are ready and not ready;
- how many repositories are loaded;
- a table of packages with version, revision and readiness;
- revisions over time by outcome;
- the age of each repository's index;
- reconcile errors and reconcile time per controller.
Without Prometheus
Everything the metrics say is also in the objects:
kubectl get packages              # READY, VERSION, REVISION
kubectl get repositories          # URL, PRIORITY, PACKAGES, READY
kubectl describe package cert-manager   # conditions and revision history